
How to Select Stocks for Swing Trading in India: A Beginner’s Step-by-Step Method
A practical NSE stock selection process for beginners: from a liquid universe to a short, ranked watchlist you can plan trades around.
Most beginners do not struggle with entries. They struggle with the step before it: deciding which stock deserves attention at all.
Open any screener and you will see hundreds of names. Pick the wrong one and even a well-timed entry will not save the trade.
This guide shows you how to select stocks for swing trading in India using a simple, repeatable process. It uses data every trader already has: NSE and BSE information, free charts and a basic screener.
You will find the process, the Indian market terms, a worked example, a scorecard, the risks and a checklist, all on this page. If you are brand new, first read our guide on how to learn swing trading in India.
How Do You Select Stocks for Swing Trading in India?
Work from wide to narrow. Remove stocks that are hard to trade, keep those moving with the market and their sector, then pick the few charts with a clear entry, stop loss and target.
- Trade liquid NSE stocks. If your order cannot fill easily, skip the stock.
- Trade with the market and the sector, not against them.
- Prefer stocks that lead their sector (relative strength).
- Check ATR% so your stop is neither too tight nor too wide.
- Skip stocks with results, surveillance flags or other events inside your trade window.
- Plan entry, stop loss and target before you place the order.
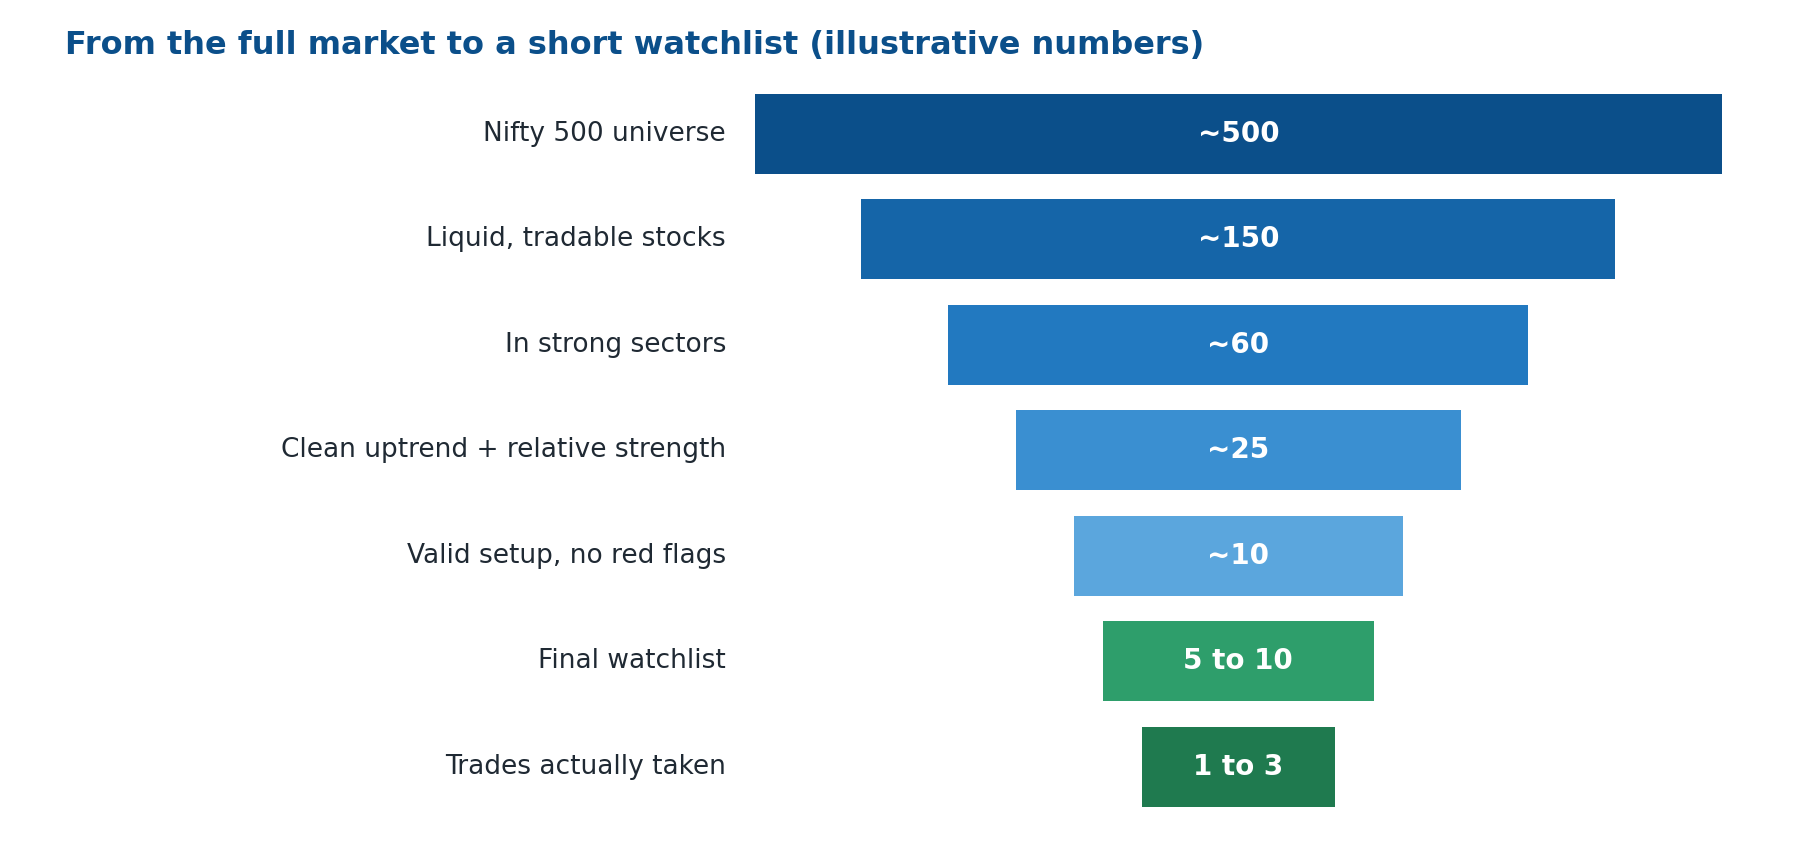
The goal is not to find the best stock in India. It is to find stocks where the risk is clear and the chart is easy to read.
Indian Market Terms You Will See in This Guide
Keep this table open while you read. It saves you from searching other websites.
| Term | Meaning in simple words | Where to check |
|---|---|---|
| ADTV | Average daily traded volume or value. Shows how easily a stock trades. | Charting platform, NSE quote page |
| Bid-ask spread | Gap between the best buy and sell price. A wide gap raises your cost. | Broker terminal |
| Price band (circuit) | Daily limit on how far a stock can move. Commonly 2%, 5%, 10% or 20%. | NSE, BSE |
| ATR / ATR% | Average True Range: the stock’s average daily range in rupees, and as a share of price. | Charting platform |
| Relative strength | Whether a stock is doing better than the Nifty or its sector. | Chart compare tool |
| Delivery % | Share of traded quantity actually taken into demat accounts, not squared off the same day. | NSE stock quote, bhavcopy |
| ASM / GSM | Surveillance lists used by NSE and BSE for stocks with unusual price moves. Trading curbs can apply. | NSE and BSE websites |
| F&O ban | Stocks where derivative positions crossed exchange limits. Fresh F&O positions are restricted. | NSE website |
| 52-week high / low | Highest and lowest price in the last year. | NSE, charting platform |
| India VIX | NSE index showing how much volatility the market expects in the near term. | NSE website |
| CNC (delivery) | Order type for buying shares to hold in your demat account. | Broker app |
| MTF | Margin Trading Facility. Your broker funds part of the purchase and charges interest. | Broker app |
| AMO | After-market order, placed when the market is closed for the next session. | Broker app |
| T+1 | Equity trades settle one working day after the trade day. | Exchange rules |
What Is Swing Trading?
Swing trading means holding a stock for a few days to a few weeks to capture one swing in price. You study daily and weekly charts and usually act after market close.
Because you hold overnight, you carry gap risk. Results, global news or a sharp fall in the Nifty can move your stock before the market opens.
| Feature | Swing trading | Intraday trading |
|---|---|---|
| Holding time | A few days to a few weeks | Same day |
| Charts used | Daily and weekly | 1 to 15 minute |
| Screen time | Low, mostly end of day | High, during market hours |
| Overnight risk | Yes | No |
| Typical order type | Delivery (CNC) | Intraday (MIS) |
| Stock selection matters | Very much: you hold through noise | Mostly liquidity and momentum |
Why Stock Selection Matters More Than Entry
A good stock gives you room to be wrong. Tight spreads, clear levels and a steady trend make it easier to place a stop loss and exit on time.
A weak stock punishes even a good plan. Thin volume, random spikes and sudden news can jump past your stop and turn a small loss into a big one.
Pros and Cons of Swing Trading
- Works on end-of-day charts, so it suits people with jobs
- No need to watch the screen all day
- Fewer trades than intraday, so fewer charges
- You can plan entry, stop and target in advance
- Can be done in delivery, without leverage
- Rewards patience and a written process
- Overnight gap risk
- A stock can open below your stop and cause a bigger loss
- Capital stays blocked for days or weeks
- Short-term gains on listed equity are taxed at 20%
- Needs discipline: boredom and fear of missing out are real
- A market-wide fall can hit many positions at once
Step-by-Step: How to Select Swing Trading Stocks
Start With a Liquid Stock Universe
Begin with the Nifty 100, Nifty 200 or Nifty 500 list on NSE. These stocks trade actively and have tighter spreads.
Add a liquidity filter in your screener, such as a minimum average daily traded value that suits your position size. Your order should be a tiny part of daily volume.
Avoid stocks that hit the circuit limit often. You may be unable to exit when you want.
Read the Direction of the Market
Most stocks follow the Nifty 50 and the Nifty 500. Open both on daily and weekly charts and ask:
- Is the index above its 50-day and 200-day moving averages?
- Is it making higher highs and higher lows, or falling and choppy?
- Is India VIX rising sharply? A jump means wider swings, so use smaller size.
- Is the Sensex telling the same story?
When the market is weak, long setups fail more often. Take fewer trades and keep position size small.
Find the Strong Sectors
Stocks rarely lead alone. Check sector indices on NSE such as Nifty Bank, IT, Auto, Pharma, FMCG, Metal, Realty and Energy.
Compare each one with the Nifty over one and three months. Prefer sectors that trade above their moving averages and beat the Nifty, then look for two or three leaders inside them.
Screen for a Clean Trend
A basic trend screen for a long-side trade could include:
- Price above the 50-day moving average
- 50-day average above the 200-day average
- A series of higher highs and higher lows
- Price within roughly 10% to 15% of its 52-week high (a common rule of thumb)
- Price not stretched far above its recent base
A screener only gives you candidates. Open each chart and confirm with your own eyes. If you have to squint to see the trend, move on.
Check Relative Strength
Relative strength compares your stock with the Nifty. If the Nifty fell 3% in a month and the stock rose 2%, the stock is showing strength.
Use the compare tool on your charting platform. Prefer stocks that held up in the last market dip and recovered before the index did.
Check Tradable Volatility With ATR%
ATR shows the average daily range in rupees. Divide it by the price to get ATR%. A ₹500 stock with an ATR of ₹10 has an ATR% of 2%.
Many beginners prefer a range of about 1% to 5%. Below that, moves may be too small to cover costs. Above that, stops get wide and position size must shrink. Treat this as a starting rule, not a law.
Confirm With Price and Volume
Price shows direction. Volume shows participation. Read them together.
| Good signs | Warning signs |
|---|---|
| Volume rises on up days | Breakout on weak volume |
| Volume dries up during pullbacks | Sharp fall on heavy volume after a long rise |
| Strong close on a breakout day | Long upper wicks near resistance |
| Delivery % rises on up days | Big spikes on thin volume |
Delivery % is a hint, not a signal. Use it to support what price and volume already show.
Mark Levels and Identify the Setup
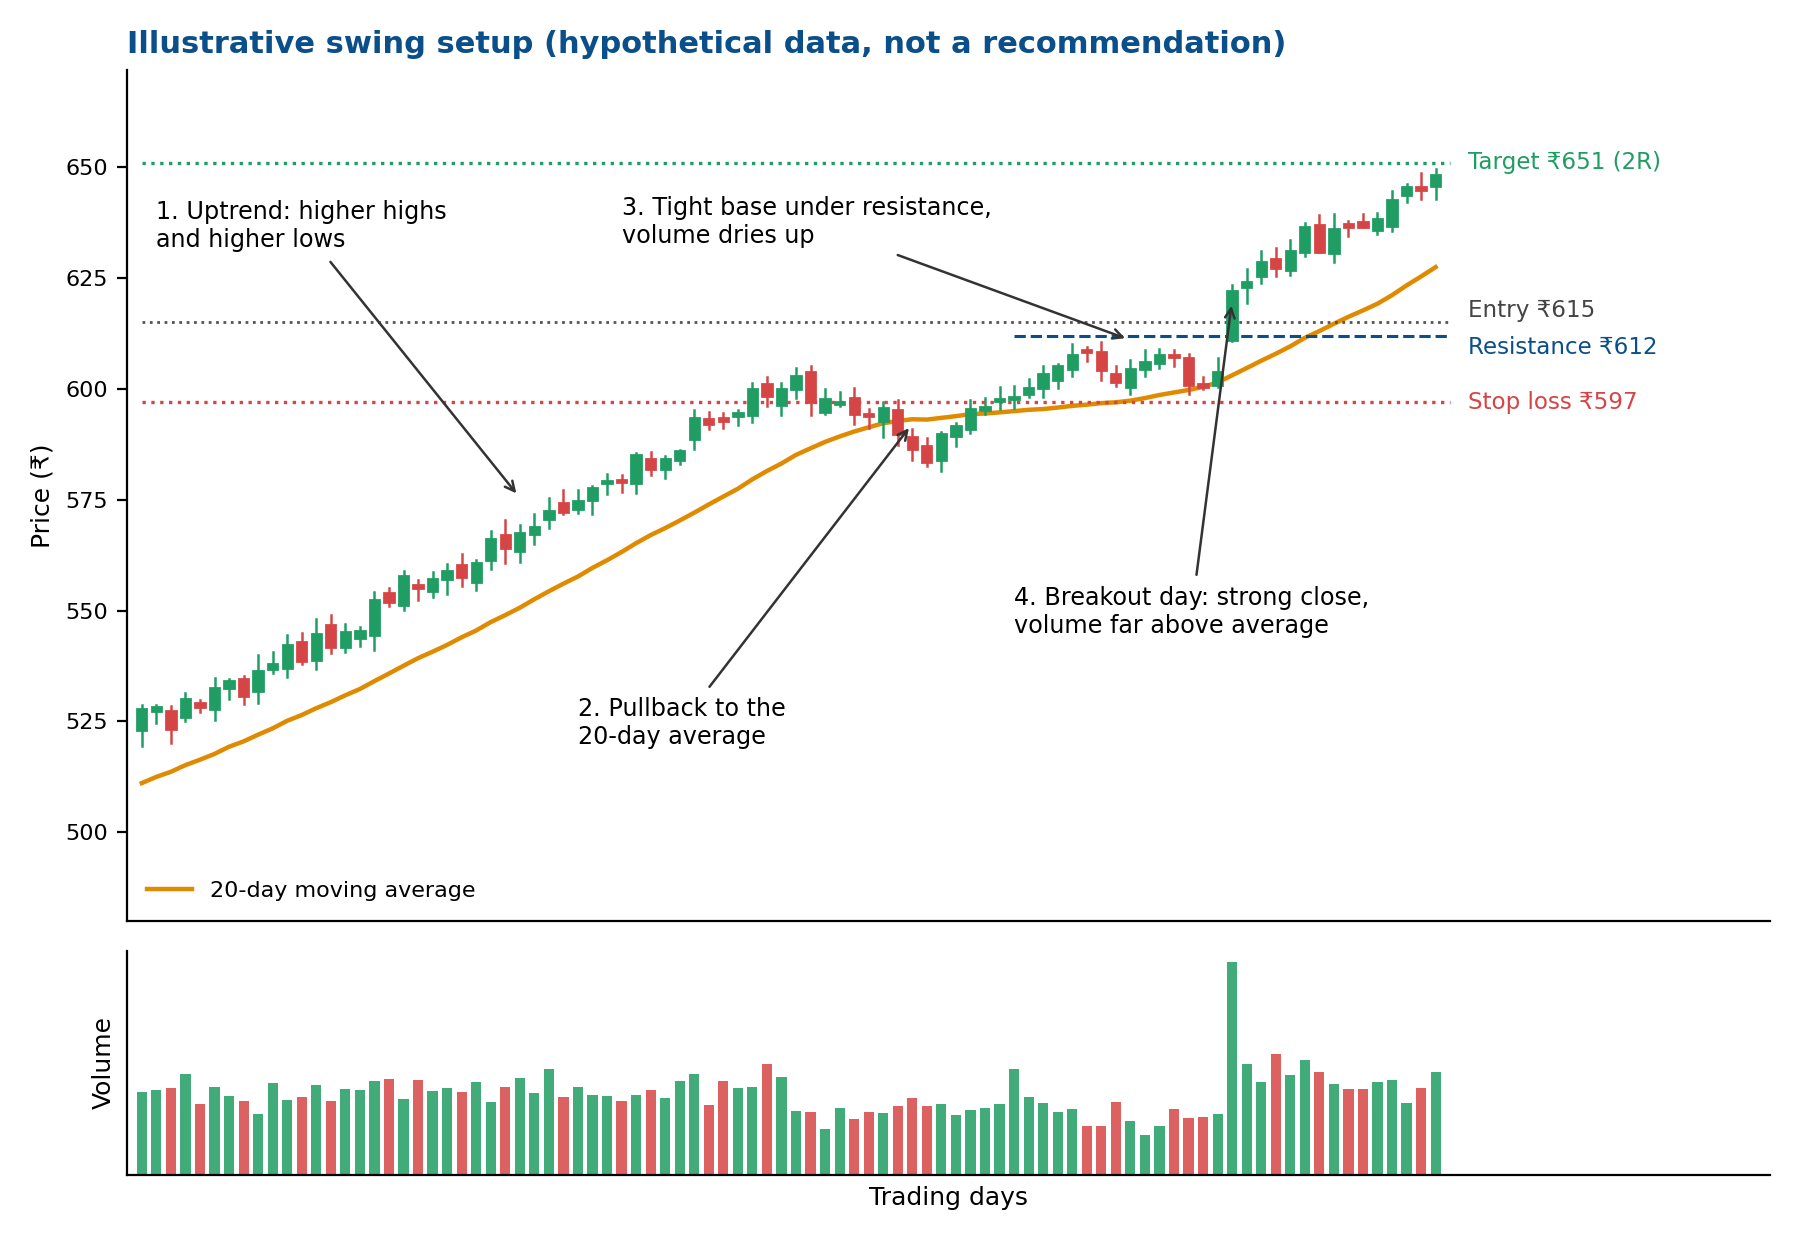
Mark nearby support and resistance using previous swing highs and lows. Add a moving average if the stock respects it.
Then name the setup. If you cannot, the stock stays on the radar and off the trade list.
Pullback
An uptrend falls back to support or a moving average, and buyers return.
Breakout
The stock moves sideways under resistance, then closes above it with strong volume.
Flag or pennant
A short, tight pause after a strong move up.
Inside day
One day’s range sits inside the previous day’s range, then price breaks in the trend direction.
Run the Red-Flag Filter
This is the step beginners skip. A clean chart can still hide a problem outside the chart.
| Red flag | Why it matters | Where to check |
|---|---|---|
| Results or board meeting inside your trade window | Earnings can cause a gap that jumps past your stop | NSE corporate announcements and board meetings calendar |
| Stock on ASM or GSM list | Higher margins and trading curbs can trap you | NSE and BSE surveillance lists |
| Stock in F&O ban | Sign of crowded derivative positions | NSE website |
| Frequent circuit hits | Exit may not be possible when you want | Price band history on NSE |
| High pledged promoter shares | Forced selling can hit the price | Shareholding pattern on NSE or BSE |
| Dividend, split, bonus or rights issue date | Price changes on the ex-date and can confuse your levels | NSE corporate actions |
| Unexplained spike or regulatory action | News or orders can reverse the move fast | NSE announcements, SEBI orders |
Check Risk-Reward and Position Size
This step separates a good chart from a good trade. Fix three levels before you place an order: entry, stop loss and first target.
Divide potential reward by potential risk. Many traders look for at least 2 times the risk (2R) as a starting benchmark.
Then size the position so a stop-out costs only a small, fixed part of capital. Many traders risk 0.5% to 2% per trade. Beginners usually start at the lower end.
Stock Scorecard: Rank Your Candidates
Score each stock from 0 to 2 on every row. Shortlist only the stocks above your own cut-off, for example 14 out of 18. The scores below are hypothetical.
| Criteria | Stock A | Stock B | Stock C |
|---|---|---|---|
| Liquidity | 2 | 2 | 1 |
| Market and sector support | 2 | 1 | 0 |
| Clean trend | 2 | 2 | 1 |
| Relative strength | 2 | 1 | 0 |
| ATR% fits your risk | 2 | 1 | 2 |
| Volume confirmation | 1 | 1 | 0 |
| Clear setup | 2 | 1 | 0 |
| No red flags | 2 | 2 | 1 |
| Risk-reward of 2R or better | 1 | 0 | 1 |
| Total (out of 18) | 16 | 11 | 6 |
| Decision | Shortlist | Watch only | Skip |
Worked Example With Position Sizing (Hypothetical)
Stock A trades near ₹600 with high daily volume, a tight spread and an ATR of ₹15 (2.5%). It sits above its 50-day average, leads its sector and beats the Nifty over three months.
| Item | Value |
|---|---|
| Resistance (top of base) | ₹612 |
| Entry: close above resistance with strong volume | ₹615 |
| Stop loss (below the base low) | ₹597 |
| Risk per share | ₹18 |
| Capital and risk | ₹5,00,000 and 1% = ₹5,000 |
| Quantity | ₹5,000 ÷ ₹18 = 277 shares |
| Position value | about ₹1.70 lakh (34% of capital) |
| First target (2R) | ₹651 |
| Loss if stopped out | about ₹4,986 plus costs |
| Profit at 2R | about ₹9,972 minus costs and tax |
If the stock gaps below ₹597 at the open, your loss will be larger than planned. That is why the red-flag filter and position size both matter.
Swing Trading Stock Selection Checklist
Use this as a final filter. Benchmarks are examples. Adjust them to your capital and risk.
| Check | Example benchmark | Why it matters |
|---|---|---|
| Liquidity | Large daily traded value; spread small compared with your stop distance | Easy entry and exit |
| Market trend | Nifty above 50-day and 200-day averages | Better odds for long setups |
| Sector strength | Sector index beating the Nifty | Stocks move with their sector |
| Stock trend | Above 50-day average, higher highs and lows | Direction is clear |
| Relative strength | Doing better than the Nifty and the sector | Leaders tend to keep leading |
| ATR% | About 1% to 5% of price | Stops and targets stay workable |
| Volume | Rising on up days, quiet on pullbacks | Shows participation |
| Levels | Clear support and resistance nearby | Defines entry and stop |
| Events | No results or major event in the trade window | Avoids gap risk |
| Risk-reward | Reward at least 2 times risk | Protects capital over many trades |
Build a Watchlist and a Weekly Routine
Keep three lists: a master list of 20 to 30 liquid stocks, an active watchlist of 5 to 10, and only 1 to 3 open trades while you are learning.
🟢 Ready
Setup is close to completion.
🟡 Watch
Interesting but not ready.
🔴 Avoid
Setup is invalid or risk is unattractive.
| When | What to do |
|---|---|
| Weekend | Check the weekly charts of the Nifty and sector indices, run your screener and rank the candidates |
| Weekday evening | See which stocks reached their planned level and update your notes |
| Alerts and AMO | Set price alerts so you do not need to watch the market live |
| Every weekend | Check the results calendar and remove stocks with events ahead |
Remove stocks that broke their structure or ran away without you. Add fresh names from your screener.
Risks You Must Understand
- Gap risk: a stock can open far below your stop loss. A stop order does not guarantee your exit price.
- Market risk: when the whole market falls, most positions fall together.
- Liquidity risk: thin stocks can be hard to sell at a fair price.
- Event risk: results, regulatory action and global news can break a good chart overnight.
- Leverage risk: SEBI studies show most individual traders lose money. About 71% of intraday cash-segment traders were loss-making in FY23, and about 91% of individual F&O traders lost money in FY25.
- Cost drag: brokerage, STT, exchange charges, GST, stamp duty and DP charges reduce every trade’s result.
- Tip risk: unregistered advisers and “guaranteed return” claims are a common source of losses.
- Emotional risk: fear, greed and revenge trading cause more damage than a bad chart.
Swing trading in delivery without leverage is not the same as F&O trading. The lesson from SEBI’s data is still useful: keep size small and treat trading as a skill you build slowly.
Common Mistakes When Selecting Swing Trading Stocks
- Choosing by price. A cheap stock is not a safer stock.
- Buying a story. News without a clean chart often ends badly.
- Ignoring the market. A good chart in a falling market still fails often.
- Watching too many stocks. A huge list slows decisions and leads to random entries.
- Chasing stocks that already ran. The stop becomes too wide.
- Skipping the risk-reward check. Every chart looks good until you measure the stop distance.
- Holding through results by accident. One gap can undo weeks of work.
- Keeping no records. Without a journal you cannot tell which rules work for you.
Tips and Recommendations
- Scan after market close, when you can think clearly.
- Avoid fresh orders in the first 15 minutes after the open. Prices are noisy.
- Write the reason for every trade before you enter it.
- Start with delivery (CNC) and your own money, not margin.
- Know your order types (limit, stop-loss, stop-loss market) and practise with a small quantity.
- Review your trades every week and note one lesson.
- Take no trade when no stock passes your checklist. Waiting is a position too.
- Confirm any adviser on SEBI’s registered intermediary search before you act on their view.
Tax and Costs for Swing Traders in India
Listed equity shares sold within 12 months give short-term capital gains. The rate is 20% plus 4% cess, and a surcharge may apply. Older articles that quote 15% are out of date.
There is no basic exemption on short-term gains. Short-term losses can be set off against capital gains and carried forward if you file your return on time.
The tax department may treat very frequent trading as business income. Rules change often, so confirm your situation with a chartered accountant.
Practise Stock Selection Before Risking Real Money
- Pick a past date and scroll the chart back to it, hiding what happened next.
- Run your screener rules on that date and shortlist five stocks.
- Mark entry, stop loss and target for each.
- Move the chart forward and compare. Note what you missed.
- Repeat on different dates and market phases, then move to paper trading or very small positions.
Record every exercise in a trading journal: stock, reason selected, market and sector status, entry, stop, target, result in R and the lesson.
For the full order of study, follow our swing trading learning roadmap.
Learn Stock Selection With More Structure
If you prefer a guided path over piecing things together alone, explore CHAMPIONS CLUB. It is an optional next step for structured learning in stock selection, technical analysis, risk management and practical swing trading.
The aim is to help you build your own process, not to hand you trades.
For ongoing education and community updates, join our Telegram channel. It does not offer guaranteed calls or profits.
Frequently Asked Questions
Which free screener should I use to find swing trading stocks?
Chartink, TradingView, Screener.in and your broker’s own scanner are widely used in India. Chartink and TradingView suit chart-based scans. Screener.in suits financial filters. Pick one, save your rules and use it for a month before changing.
Why does my stock hit my stop loss and then go up?
Usually the stop sits inside normal daily movement. If it is less than one ATR from your entry, ordinary swings can trigger it. Place it beyond the last swing low with a buffer, and cut quantity instead of tightening the stop.
How do I avoid fake breakouts?
Wait for a daily close above resistance with volume well above its recent average, and check that the market is not weak. Some traders wait for a retest of the breakout level. The trade-off is that you may miss fast moves.
Are small-cap stocks better for bigger swing trading profits?
They can move faster, but spreads are wider, circuits are common and exits can be hard. Beginners usually learn faster with large and mid-cap stocks. Consider smaller names only after your records show a steady process.
Can I start swing trading with ₹10,000?
You can learn with it, but costs bite and position sizes get tiny. A 1% risk on ₹10,000 is only ₹100. Use this stage for paper trading and journaling, and never borrow money to trade.
Should I use MTF or margin for swing trades?
Not as a beginner. Margin magnifies both gains and losses and adds interest cost. Start with delivery using money you can afford to put at risk.
Are tips on Telegram, YouTube and WhatsApp safe to follow?
Treat any tip, from any source, as an idea to study and not an instruction. SEBI requires investment advisers and research analysts to be registered, so check their status on SEBI’s website. Be careful with anyone promising fixed or guaranteed returns.
Should I place orders at the market open or use AMO?
Opening prices swing a lot. Many traders avoid the first 15 minutes, use limit orders and plan with alerts or AMO. Remember an AMO can fill at a gap price, so check the order type before you submit.
How many swing trades should I take in a week?
Quality matters more than count. While learning, one to three open trades are manageable. Taking no trade is a valid decision when the market is weak or no stock passes your checklist.
Final Thoughts
Selecting stocks well is less about finding a secret indicator and more about running the same checks every time.
- Start with liquid stocks and the direction of the market.
- Move to sectors, trend, relative strength and volume.
- Mark levels, name the setup and run the red-flag check.
- Size the position before you enter.
- Practise on old charts and keep a journal.
You do not need to trade every day. You do not need to watch the market all day. You need a process you understand, can test and can follow.